scmags.ScMags.dot_plot
- ScMags.dot_plot(cmap=<matplotlib.colors.LinearSegmentedColormap object>, figsize=(6, 14), log_transform=True, grid=False, plot_legends=True, plot_brackets=True, size_leg_title='Fraction of cells\\nin group (%)', col_leg_title='Mean expression\\nin group', wspace=0, largest_dot=90.0, smallest_dot=0.0, size_exponent=1.5, dot_edge_lw=1.2, dot_edge_color='k', legends_width=1.5, bracket_width=0.35, bracket_top_adj=-0.5, bracket_bot_adj=0.5, plot_name='scmags_dotplot', save_plot=False, plot_dpi=300)
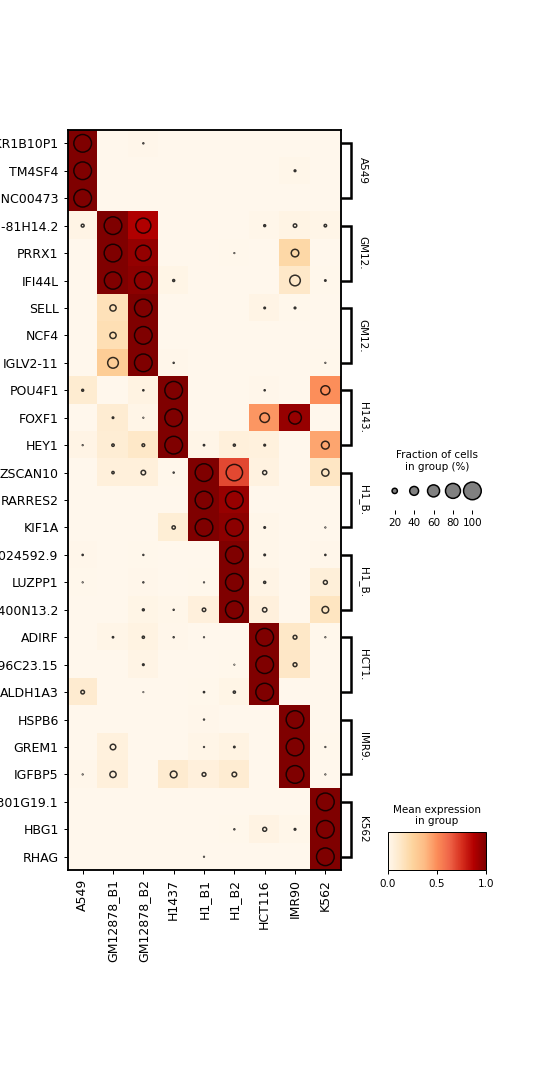
This function draws the dot plot from the scanpy library In this plot,the colors represent the normalized within-cluster average expression, and the circles represent the within-cluster expression rates.
- Parameters
cmap (
Optional[str]) – Colormap for dotplot.figsize (
Optional[Tuple[int,int]]) – Figure size.log_transform (
bool) – Performs log normalization before finding in-cluster mean values.grid (
bool) – Draws grid.plot_legends (
bool) – Adds legends.plot_legends – Adds brackets.
size_leg_title (
Optional[str]) – Size legend title.col_leg_title (
Optional[str]) – Colorbar title.wspace (
Optional[float]) – The space between the legends and the main plot.largest_dot (
Optional[float]) – The size of the largest ring.smallest_dot (
Optional[float]) – The size of the smallest ring.size_exponent (
Optional[float]) – The exponential coefficient used for scaling expression rates.dot_edge_lw (
Optional[float]) – Thickness of the rings.dot_edge_color (
Optional[str]) – Color of the rings.legends_width (
Optional[float]) – Width of legends by figure.bracket_width (
Optional[float]) – Width of legends by figure.bracket_top_adj (
Optional[float]) – Adjustment that allows the brackets to slide up.bracket_bot_adj (
Optional[float]) – Adjustment that allows the brackets to slide downplot_name (
Optional[str]) – Name of plot to savesave_plot (
bool) – If True, the plot is saved in the working directory.plot_dpi (
int) – The dpi value of the figure to be saved
Examples
>>> import scmags as mg
>>> li = mg.datasets.li()
>>> li.filter_genes()
>>> li.sel_clust_marker()
>>> li.dot_plot(figsize = (6,12), largest_dot = 200)