scmags.ScMags.markers_tSNE
- ScMags.markers_tSNE(log_norm=True, n_iter=1000, perplexity=30, learning_rate=200, x_y_labels=True, ax_spines=True, main_title='tSNE Plot of Markers', figsize=(13, 11), cmap=<matplotlib.colors.LinearSegmentedColormap object>, plot_name='scmags_tsne_of_markers', save_plot=False, plot_dpi=300)
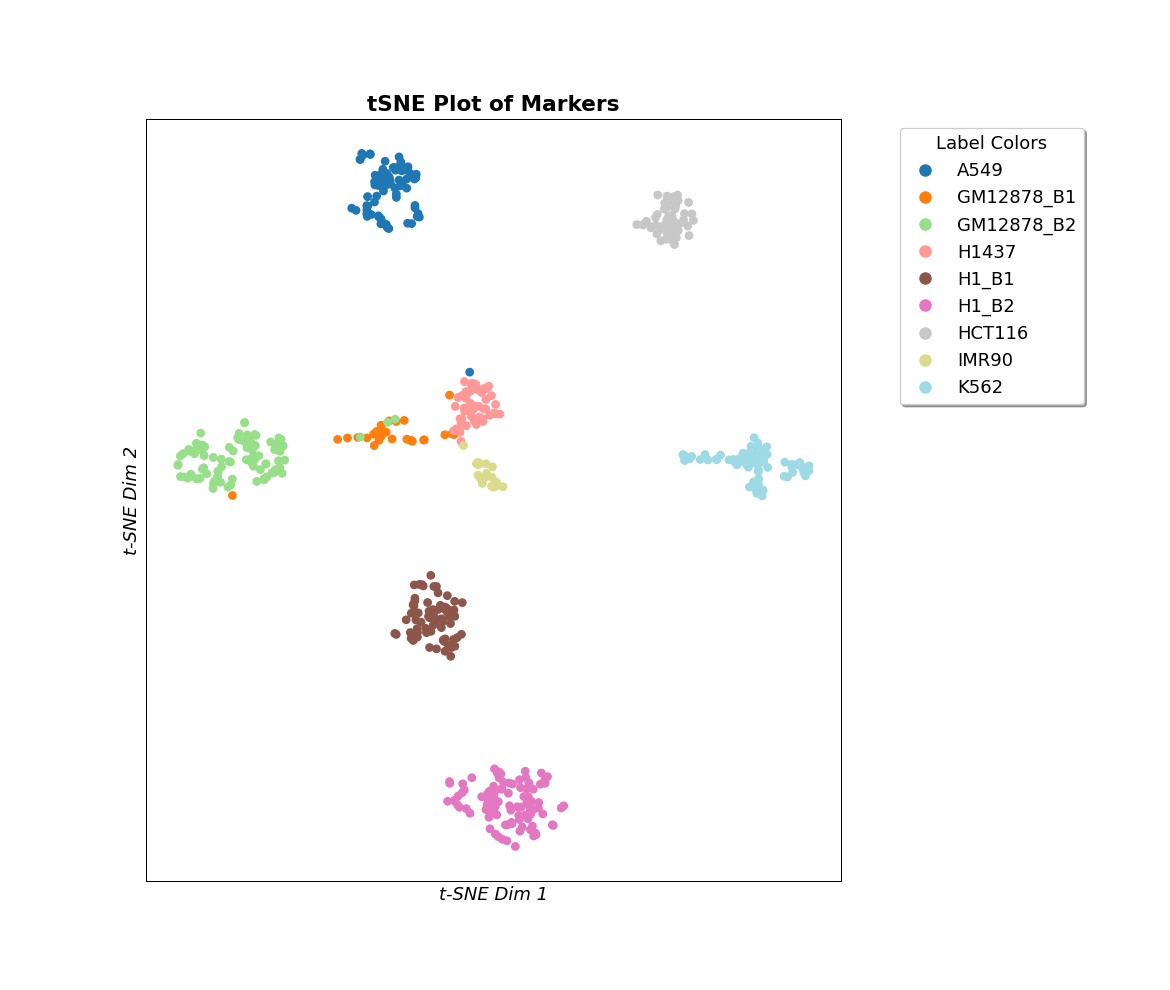
Draws tSNE plot with selected markers
- Parameters
log_norm (
bool) – Performs log normalization before t-SNE.n_iter (
Optional[int]) – Maximum number of iterations for the optimization.perplexity (
Optional[int]) – The perplexity is related to the number of nearest neighbors that is used in other manifold learning algorithms. Larger datasets usually require a larger perplexity.learning_rate (
Optional[int]) – The learning rate for t-SNE is usually in the range [10.0, 1000.0].x_y_labels (
bool) – Draws the x and y axis labels.ax_spines (
bool) – Draws plot frames.main_title (Optional[str], optional) – Main title..
figsize (
Optional[Tuple[int,int]]) – Figure size.cmap (
Optional[str]) – A Colormap instance or registered colormap name. (matplotlib cmap)plot_name (
Optional[str]) – Name of plot to savesave_plot (
bool) – If True, the plot is saved in the working directory.plot_dpi (
int) – The dpi value of the figure to be saved
Examples
>>> import scmags as mg
>>> li = mg.datasets.li()
>>> li.filter_genes()
>>> li.sel_clust_marker()
>>> li.markers_tSNE()