scmags.ScMags.markers_heatmap
- ScMags.markers_heatmap(scale=True, log_norm=True, cmap=<matplotlib.colors.LinearSegmentedColormap object>, figsize=(15, 16), plot_name='scmags_heatmap_of_markers', save_plot=False, plot_dpi=300)
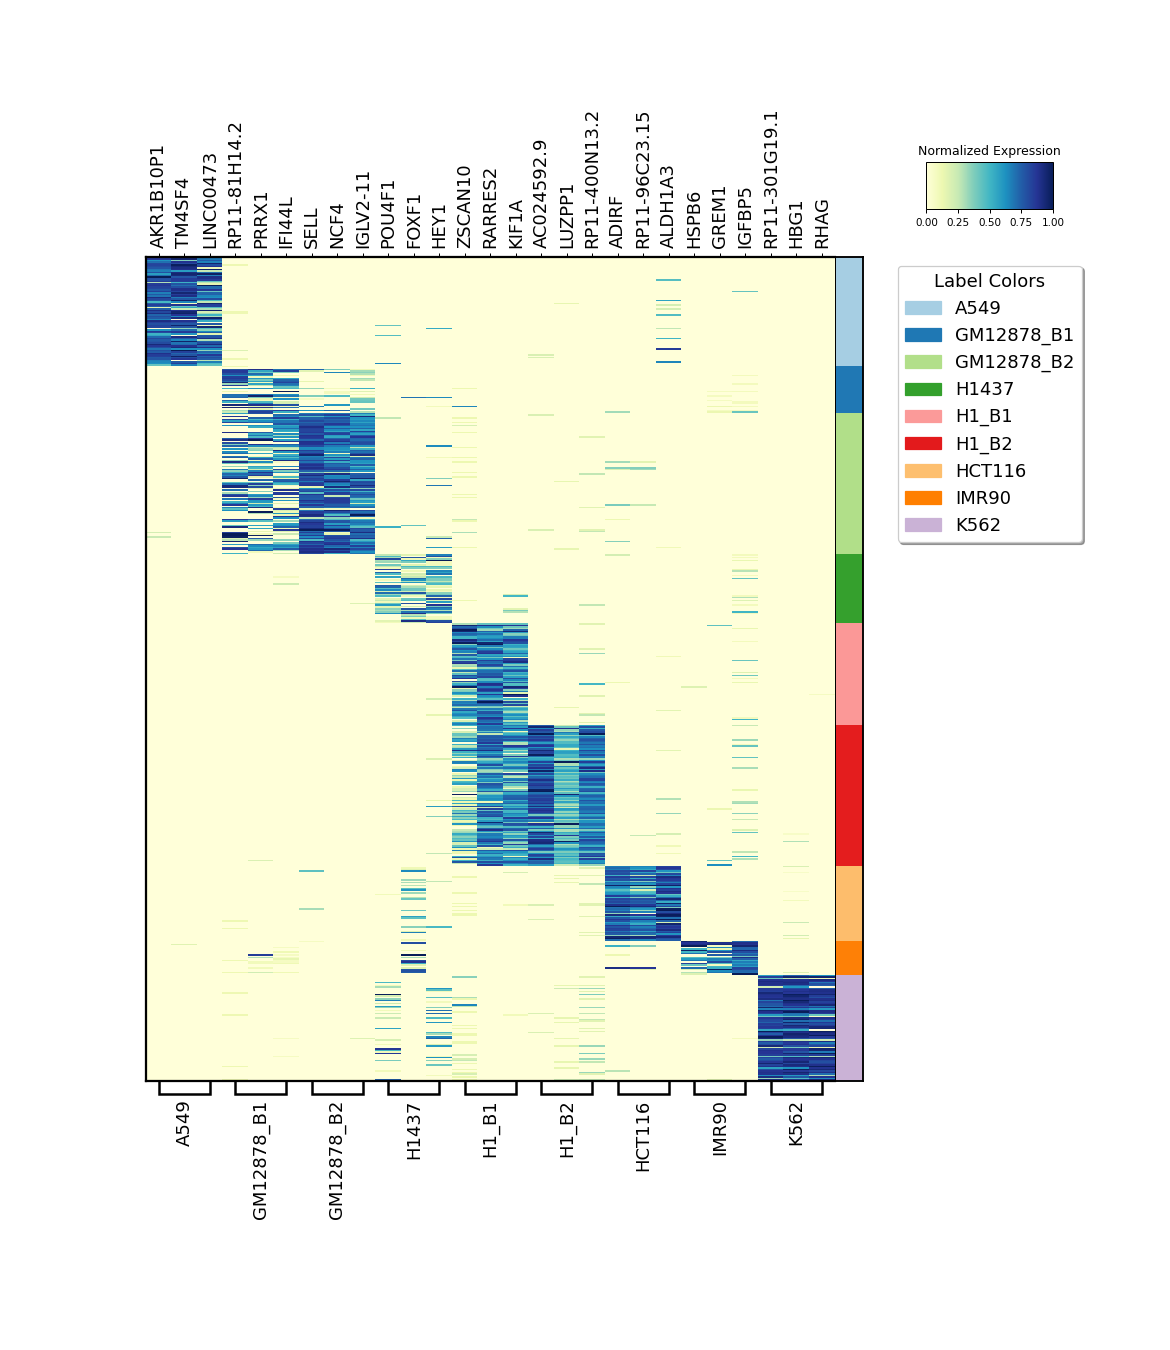
Draws a heatmap with selected markers
- Parameters
scale (
bool) – Scales marker genes from 0 to 1.log_norm (
bool) – Performs log normalization before scaling.figsize (
Optional[Tuple[int,int]]) – Figure size.cmap (
Optional[str]) – A Colormap instance or registered colormap name. (matplotlib cmap)plot_name (
Optional[str]) – Name of plot to savesave_plot (
bool) – If True, the plot is saved in the working directory.plot_dpi (
int) – The dpi value of the figure to be saved
Examples
>>> import scmags as mg
>>> li = mg.datasets.li()
>>> li.filter_genes()
>>> li.sel_clust_marker()
>>> li.markers_heatmap(figsize = (13,15))